Create a Container Placement Report Using the Map
This article explains how to draw a shape on the large map and create a container placement report using the map markers inside it.
Before You Begin
You must use TeleRoute to create a report from the large map. You must place something on the map first for Trash Flow to create the list: a route, customers, work orders, or container placements. Part I: Draw the Map Boundary
- Open the Large Map. You can open the map by clicking TeleRoute > Routes > Show a Route and entering one of your routes. The map can also be opened from a container placement, the Teleroute button, the Dispatch window, the Map tab on a customer account, etc.
- Click the boundary button at top right
 , then choose whether to draw a Polygon or a Circle.
 For a :
- Click a point on the map to begin. Think of this as the first point of the shape you're drawing.
- Move your mouse and click again. This creates a line between the two points.
- Repeat as needed, drawing lines around the area you want to capture. Do not cross back over any lines you've already created.
- End by clicking back on the initial point to create an enclosed shape.
- Click the center of the area you want to encircle.
- Move your mouse to make the circle wider.
- When the circle is the size you want it click the mouse.
- A window appears. Click in the "Enter Boundary Name" field and enter what you want to call this area.
- Click .
- A window appears reading "Boundary saved successfully!" and the boundary menu changes to show the boundary name and a list of available functions. Click to finish.
For a :
Part II: Create the Report
-
In the Boundary Menu of the map click .
-
For Report based on choose whether you want the report to include only the container placement markers inside the shape or all visible markers. Other marker types include work orders, route stops, and customers.
-
If you want a comma-separated value (CSV) file to view in Excel instead of viewing a PDF then check Export to CSV File?.
-
Check the data display boxes if you want to show the placement Rates, Location Address, or Notes.
-
Click to finish.
When You're Done
The report opens in your PDF viewer if you chose the printout format. If you chose to create a CSV then Windows will prompt you to choose a save location.
Sample Report
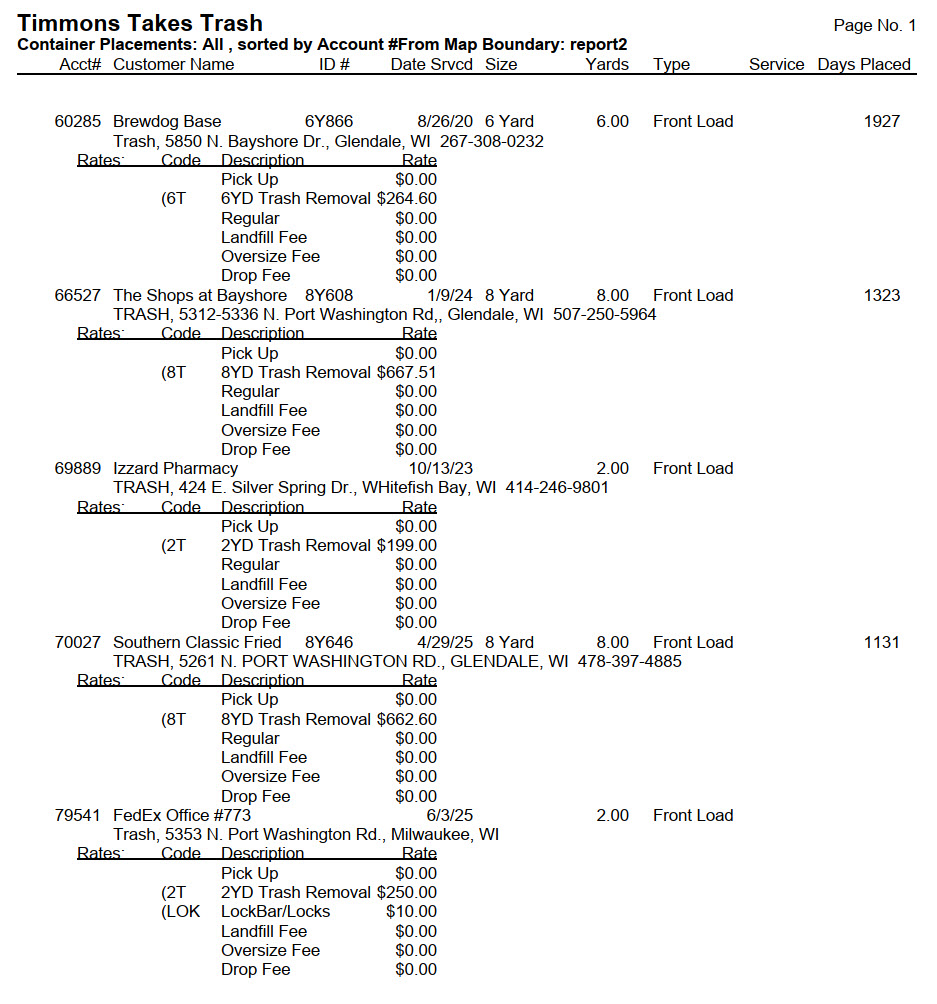
Example: Drawing shapes on the map
How to draw a polygon
See Also
Links to other relevant topics