Create a Customer List Using the Map
This article explains how to draw a shape on the large map and create a customer list of the map markers inside it.
Before You Begin
You must have TeleRoute to create a list from the large map. You must have something on the map for Trash Flow to use when creating the list: a route, customers, work orders, or container placements.
Part I: Draw the Map Boundary
- Open the Large Map. You can open the map by clicking TeleRoute > Routes > Show a Route and entering one of your routes. The map can also be opened from a container placement, the Teleroute button, the Dispatch window, the Map tab on a customer account, etc.
- Click the boundary button
 at top right , then choose whether to draw a Polygon or a Circle.
 For a :
- Click a point on the map to begin. Think of this as the first point of the shape you're drawing.
- Move your mouse and click again. This creates a line between the two points.
- Repeat as needed, drawing lines around the area you want to capture. Do not cross back over any lines you've already created.
- End by clicking back on the initial point to create an enclosed shape.
- Click the center of the area you want to circle.
- Move your mouse to make the circle wider.
- When the circle is the size you want it click the mouse.
- A window appears. Click in the "Enter Boundary Name" field and enter what you want to call this area.
- Click .
- A window appears reading "Boundary saved successfully!" and the boundary menu changes to show the boundary name and a list of available functions. Click to finish.
For a :
Part II: Create the Report
-
When a boundary is selected the Boundary Menu at top-right of the map displays the name of the saved boundary. In the Boundary Menu of the map click .
Note: If you need to select a boundary click the three-line map at top left, click Boundary Key, and select a boundary from the list.
-
Click .
-
Choose a Report Format and what method the report should Sort by.
-
For Report based on choose whether you want the report to include only the customer markers/flags inside the shape or all visible markers. Other marker types include work orders, route stops, and container placements.
-
Leave Show Details checked unless you only want a count of how many customers are inside the boundary.
-
Use the remaining data display settings to choose whether you want the report to include the customers' rates, addresses, phone numbers, routes, containers, email address, notes, and pop-up notes.
-
Click to finish.
When You're Done
The report opens in your PDF viewer if you chose the printout format. Other formats might have you choose fields for a CSV, walk you through sending a bulk email, etc.
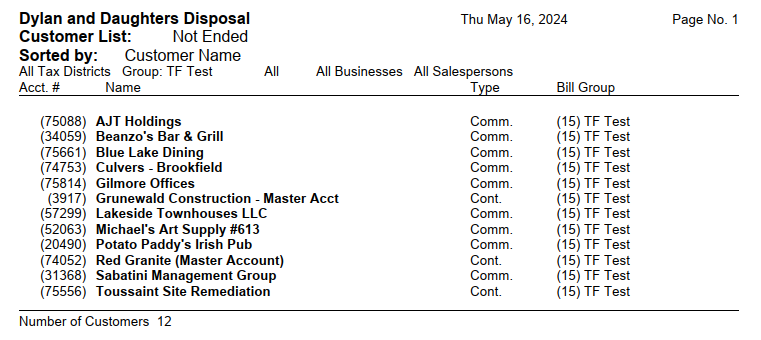
Sample Report
Example: Drawing shapes on the map
How to draw a polygon
See Also
Create a Container Placement Report Using the Map